Search This Blog

Showing posts with label gnuplot. Show all posts

Sunday, November 01, 2020

edsn: Elite Dangerous Star Neighborhood

 Description

Virtual, for ever I was fascinating with maps of our star neighbourhood. Just like the one from European Southern Observatory website. Recently, I've enjoyed playing Elite Dangerous. I enjoy it even more, because it works perfectly fine on Linux (with Proton).  One of the great thing about Elite is freedom to roam between stars and visit, so many star neighbourhoods. 

The amount of stars is breathtaking. It's hard to visualize the ones which are close to the system you are in. So, I wrote a small Python script to get data from edsm and prepare them to be visualized with GNUplot.

Examples

Sol

Home, sweet home.
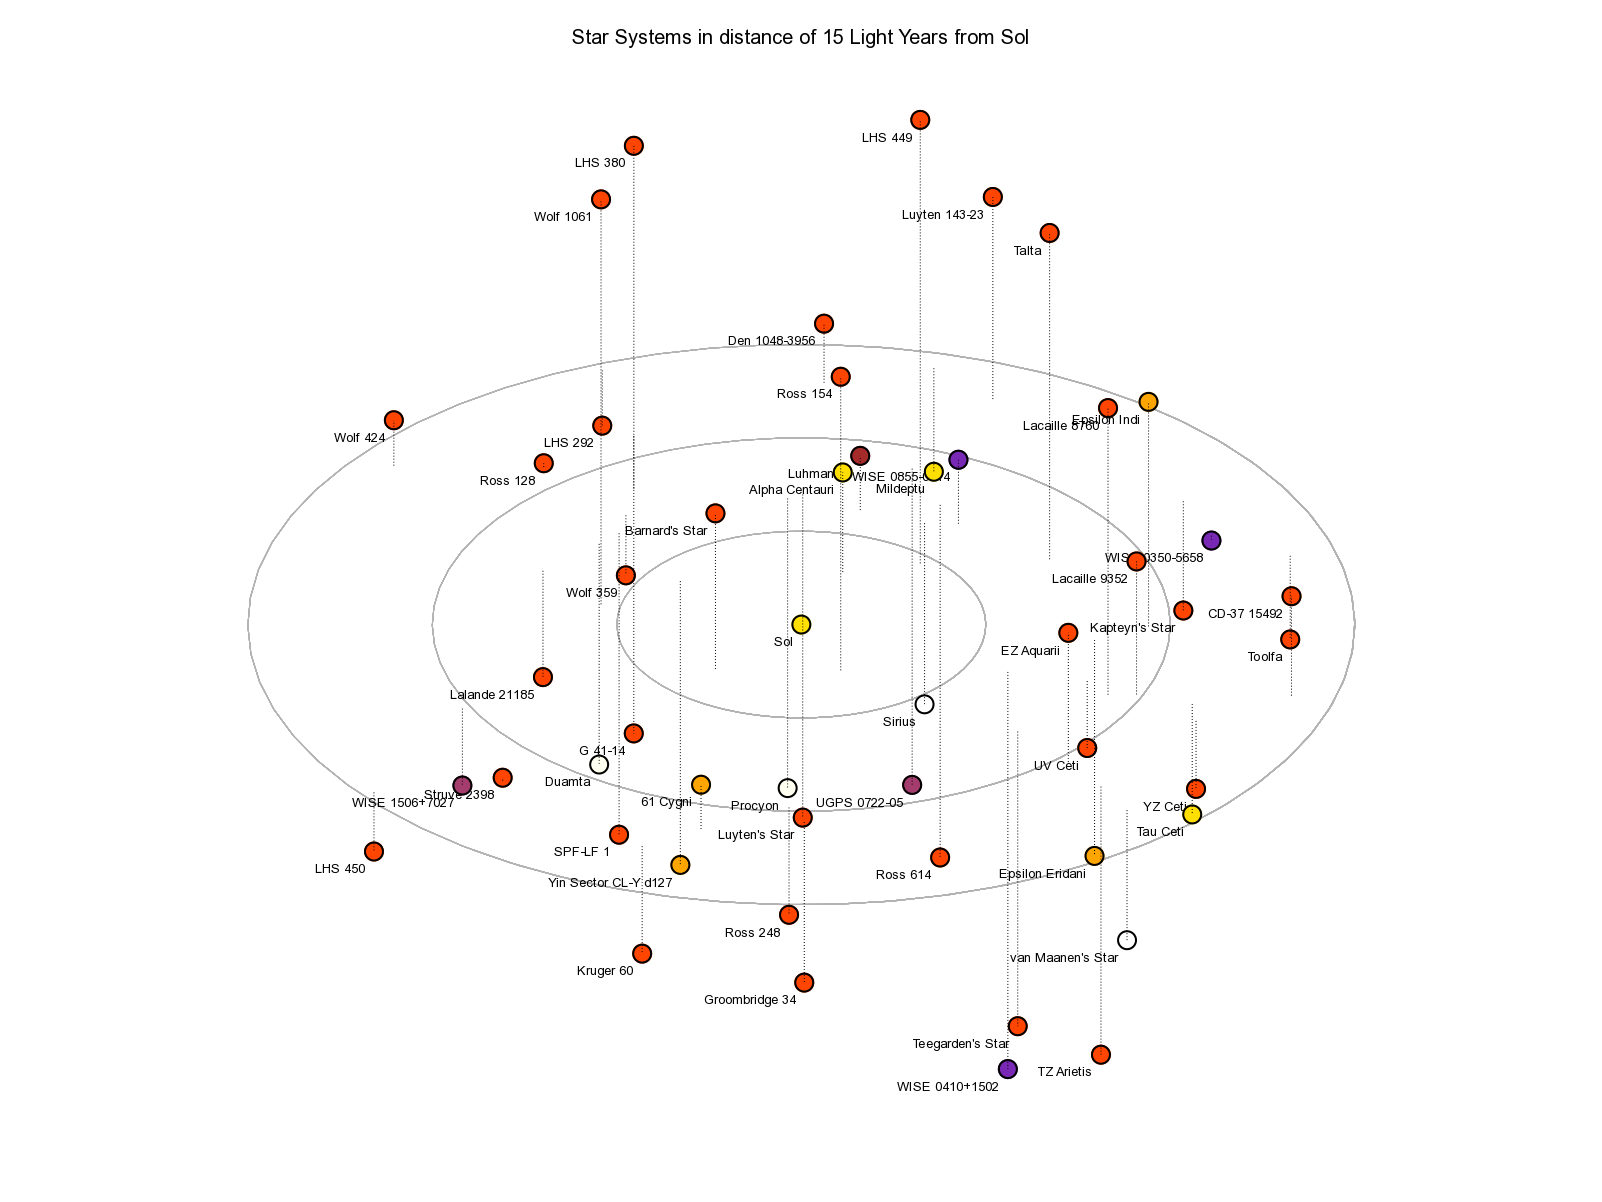
Stars in less than 15 Light Years from Sol

These are the commands to produce the SVG output after loading script and data into Gnuplot.

set term svg size 1600,1200
set view 45, 290, 1.25, 1.5
set output 'sol-r15.svg'; replot

Achenar

 I didn't know that the space around Achenar is so empty (OK. I don't have permit yet).
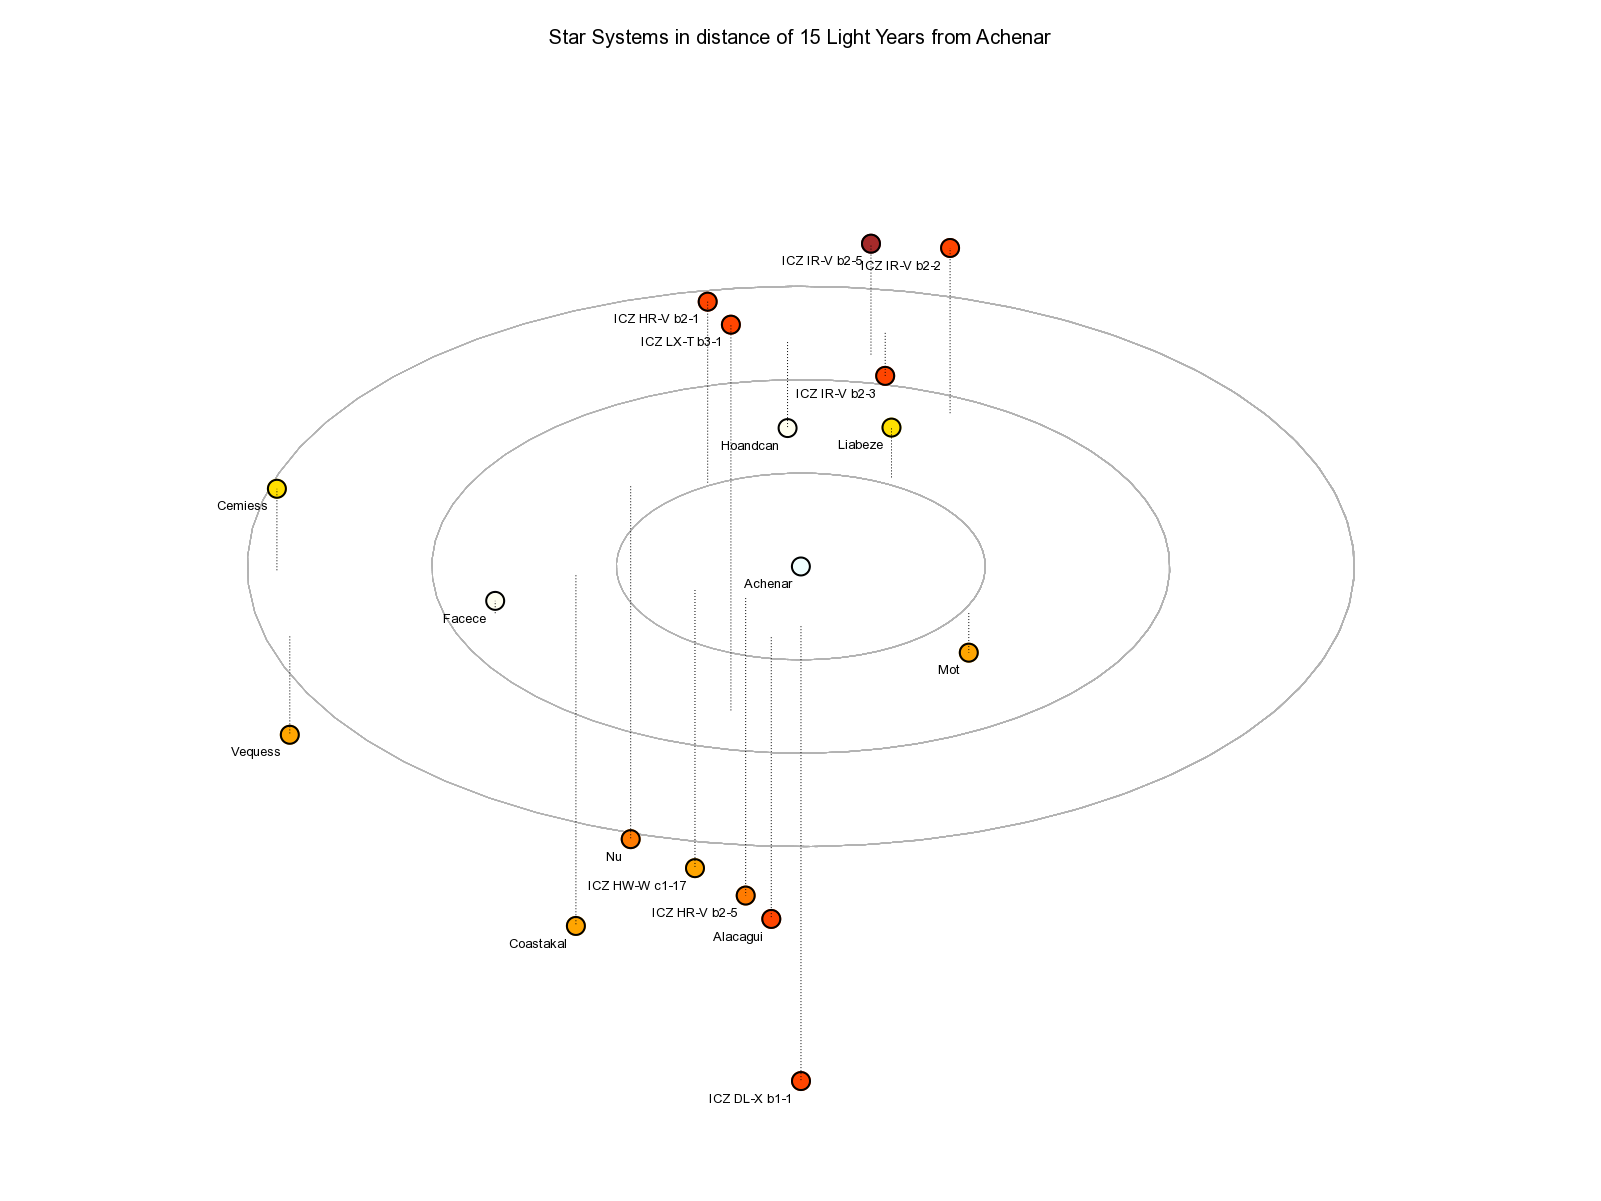
Stars in less than 15 Light Years from Achenar

These are the commands to produce the SVG output after loading script and data into Gnuplot.

set term svg size 1600,1200
set view 45, 275, 1.25, 1.5
set output 'achenar-r15.svg'; replot

Monday, December 22, 2008

Another Awk one-liner

This one-liner printing third word from the lines beginning with "Mem:" (precisely the lines which first word is "Mem:") but adding the serial number before the word.
awk 'BEGIN {a=1} \
{if ( $1 == "Mem:" ) \
  {printf "%4d  %s\n",  a, $3; a++}}' \
free-prefork.log >mem-prefork.log
BTW. This script is to help me to plot a gnuplot graph based on "used memory" number from free command. plot "mem-prefork.log" will do the rest of job. UPDATE Mike Hommey post force me to rethink my scripts and I found easy way to eliminate if clause:
awk 'BEGIN {a=1} \
/^Mem:/  {printf "%4d  %s\n",  a, $3; a++}' \
free-prefork.log >mem-prefork.log

Monday, December 08, 2008

Gnuplot with readline on MacOSX

Recently, I tried to use gnuplot on a Mac, and, of course, it wasn't working properly. Apple prepared and shipped with MacOS its own (broken) version of readline library with didn't work with gnuplot (known bug). So I grabbed the sources of readline, applied all of patches and built mine version of readline. Next, I added the proper option to gnuplot configure file, but it wasn't pass to makefile. I looked into the Makefiles and found the the TERMLIBS option had to be change. I.e. using such command:
find . -name Makefile \
-exec sed -i.old "s/TERMLIBS\ =/TERMLIBS = -L\/usr\/local\/lib/" {} \; 
Two more things about gnuplot and MacOSX.
  1. I started to think to make a gnuplot.app for MacOSX, but sure how it should work.
  2. I found that X11 term is much better then Aqua, in particular, it's allow to rotate 3D (s)plots.

Wednesday, June 04, 2008

Yet Another Gnuplot Script

I'm preparing presentation for the Public Defence of my PhD thesis. I'm creating few plots and of course I'm using gnuplot for them. One of plots is seems to be really simple: three 'columns' each in other colour, but it took me few hours to make it. I'm glad that I finally did it so I'm sharing my scripts with you (I needed Postscript for Greek's symbols):
set term postscript eps enhanced color
set output "nlo-rhb-cc.eps"
set ylabel '{/Symbol b} [10^{-30} esu]'
set style data histogram
set style histogram cluster gap 1
set style fill solid border -1
set boxwidth
unset xtics

plot [-0.5:.7][-15000:0] "cc.csv" using 1 ti col, '' using 2 ti col, '' using 3 ti col
If you would like to try use the data below: and data:
HF/FF MP2/FF CCSD
-14720.51945800 -6960.7083277 -10843.140 
BTW. I noted three new interesting website related to the gnuplot:

Saturday, April 08, 2006

Points style in Gnuplot - part II

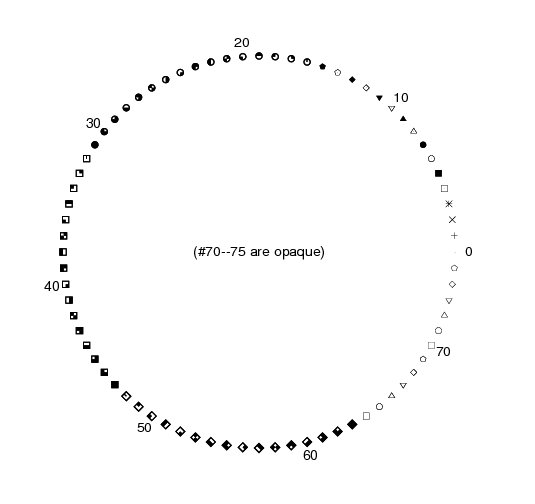
My friend Paweł Kędzierski showed me another (better?) way how to present points style in gnuplot. It is describe in docs. (Shame on me!) The ps_symbols.gpi script can be found in gnuplot docs directory or hear. Below you see output from it: BTW I would like to add link to another nice site with gnuplot images. It was created by Petr Mikulik.

Thursday, April 06, 2006

Points style in Gnuplot

It's quite annoying to find the best points styles for your postscript output from gnuplot. I tried to find the site with list of all points style, but I failed, so made my own:
set term postscript
set output "test.ps"
set xrange [0:30]
set yrange [0:30]
set key right bottom
plot   x+1   with linespoints pt 1 title "1",  
       x+2   with linespoints pt 2 title "2",
       x+3   with linespoints pt 3 title "3",
       x+4   with linespoints pt 4 title "4",
       x+5   with linespoints pt 5 title "5",
       x+6   with linespoints pt 6 title "6",
       x+7   with linespoints pt 7 title "7",
       x+8   with linespoints pt 8 title "8",
       x+9   with linespoints pt 9 title "9",
       x+10  with linespoints pt 10 title "10",
       x+11  with linespoints pt 11 title "11",
       x+12  with linespoints pt 12 title "12",
       x+13  with linespoints pt 13 title "13",
       x+14  with linespoints pt 14 title "14",
       x+15  with linespoints pt 15 title "15",
       x+16  with linespoints pt 16 title "16",
       x+17  with linespoints pt 17 title "17",
       x+18  with linespoints pt 18 title "18",
       x+19  with linespoints pt 19 title "19",
       x+20  with linespoints pt 20 title "20"
The result is below. It was obtained by: convert test.ps test.png (and next rotated):

Monday, February 27, 2006

Great site about Gnuplot

Gnuplot is very good data and function plotting utility. There are a lot of demos what can you do with in at official website. But advises prepared by Toshihiko Kawano from Los Alamos National Laboratory are amazing. Check this link and learn what you can do with gnuplot!