Description
Virtual, for ever I was fascinating with maps of our star neighbourhood. Just like the one from European Southern Observatory website. Recently, I've enjoyed playing Elite Dangerous. I enjoy it even more, because it works perfectly fine on Linux (with Proton). One of the great thing about Elite is freedom to roam between stars and visit, so many star neighbourhoods.
The amount of stars is breathtaking. It's hard to visualize the ones which are close to the system you are in. So, I wrote a small Python script to get data from edsm and prepare them to be visualized with GNUplot.
Examples
Sol
Home, sweet home.
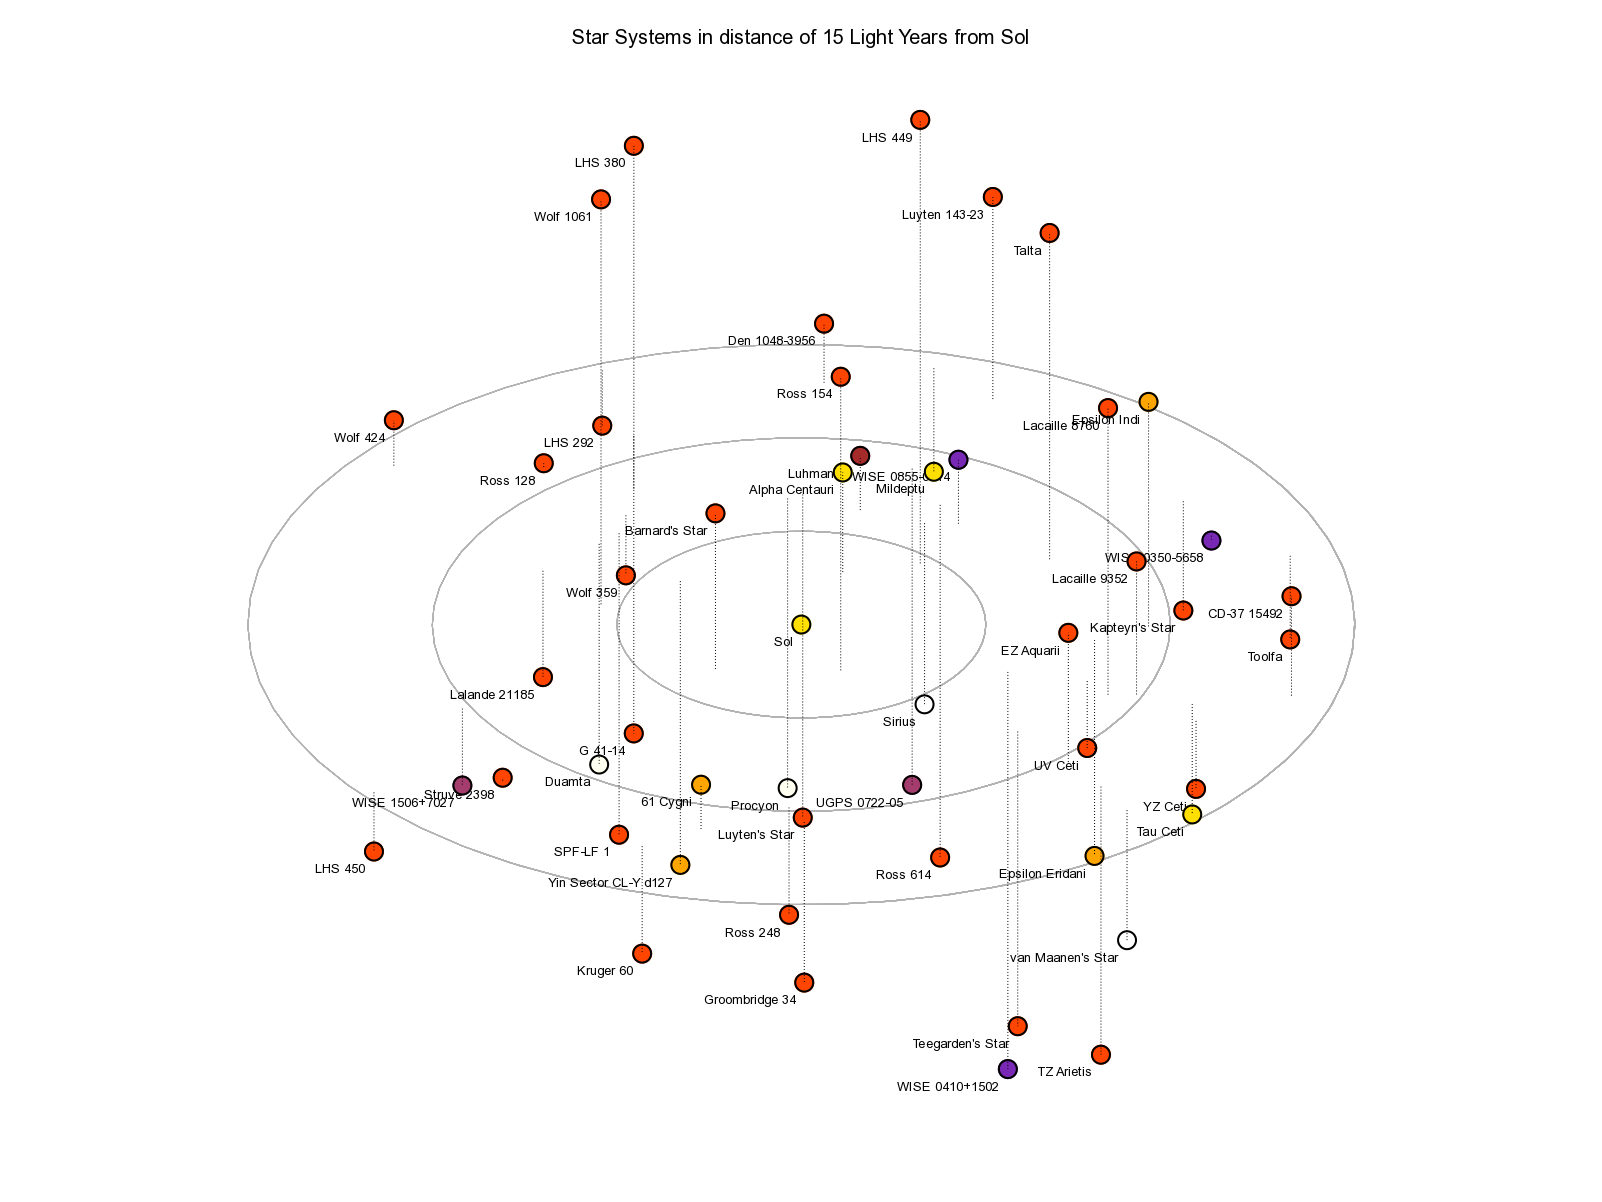
These are the commands to produce the SVG output after loading script and data into Gnuplot.
set term svg size 1600,1200
set view 45, 290, 1.25, 1.5
set output 'sol-r15.svg'; replot
Achenar
I didn't know that the space around Achenar is so empty (OK. I don't have permit yet).
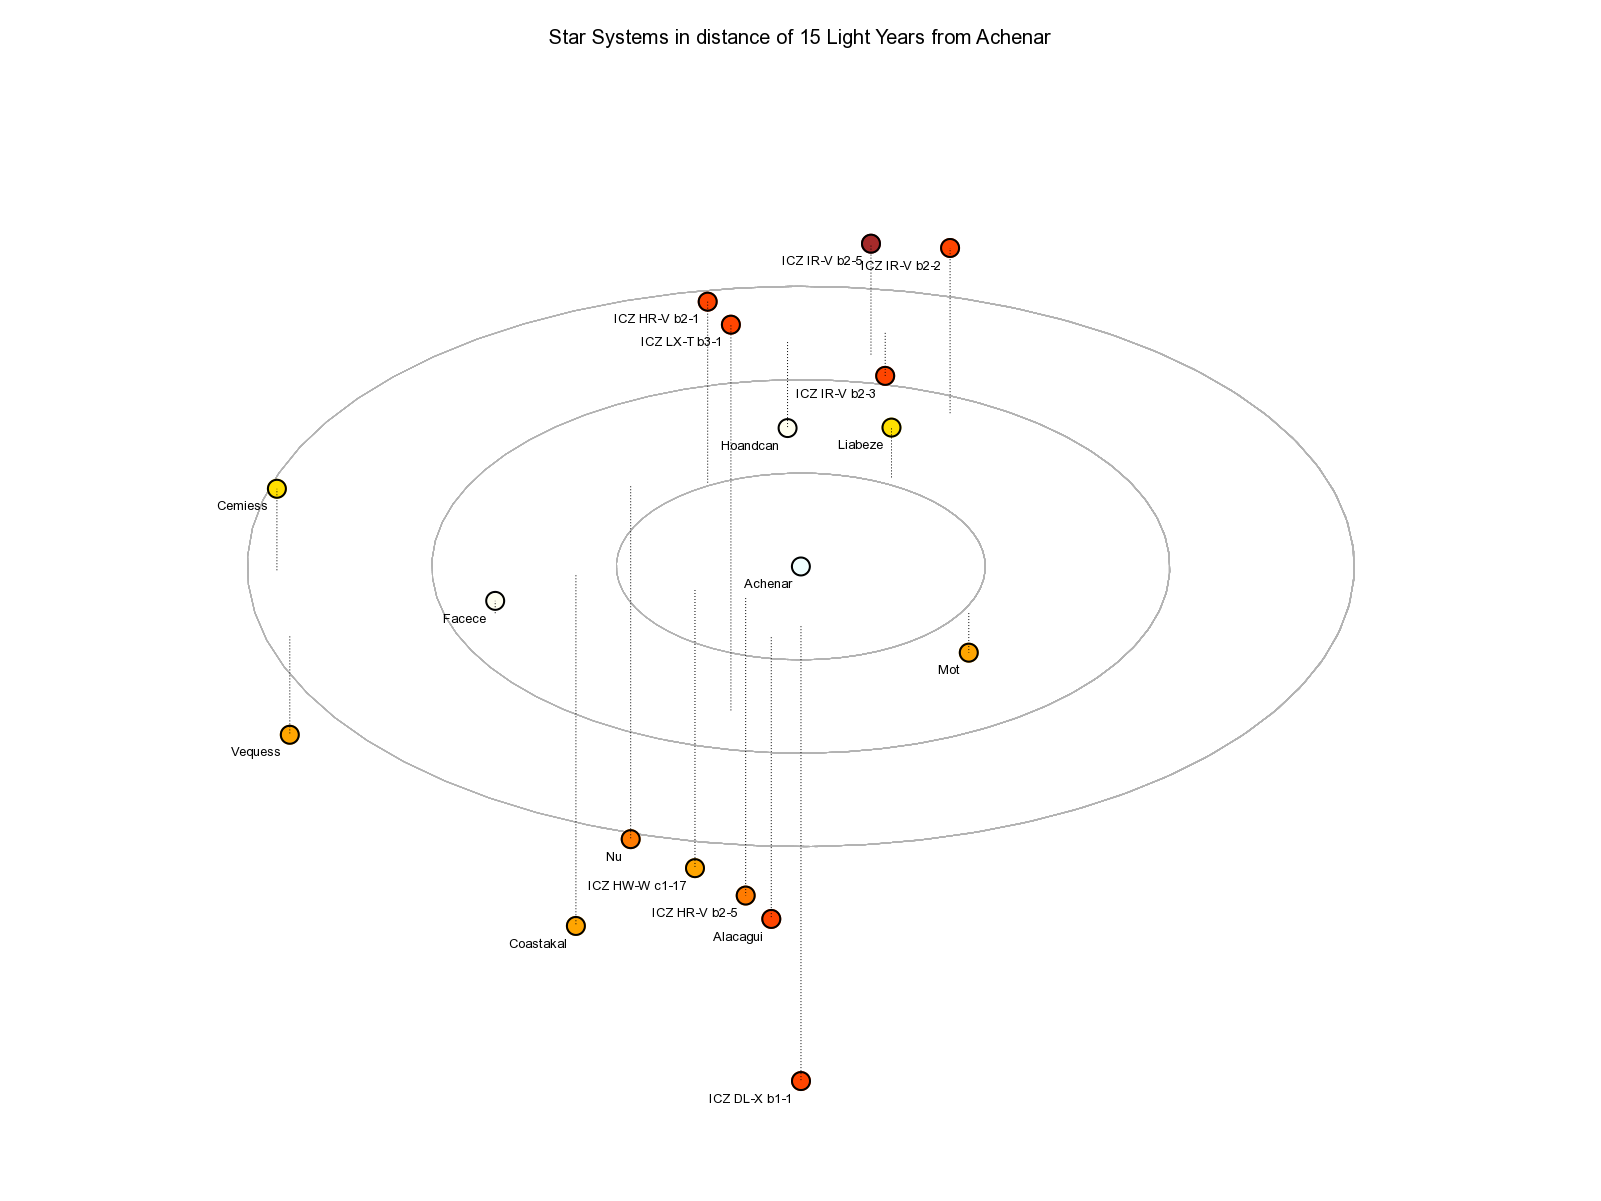
These are the commands to produce the SVG output after loading script and data into Gnuplot.
set term svg size 1600,1200
set view 45, 275, 1.25, 1.5
set output 'achenar-r15.svg'; replot